
There is no shortage of studies and statistics related to divorce on the internet. In fact, if you Google “divorce statistics”, you’ll be met with over 80,000,000 results. Chances are, if an element of a marriage carries even the slightest possibility of leading to divorce, it’s been studied by researchers.
Trying to wade through divorce research can be time consuming and overwhelming. To save you some time, the attorneys at The Wright Firm, LLP have compiled some of the more interesting national and local Texas statistics onto this page. Some of the findings revealed by more recent studies have been downright shocking.
National US Divorce Statistics

Are national divorce rates declining?
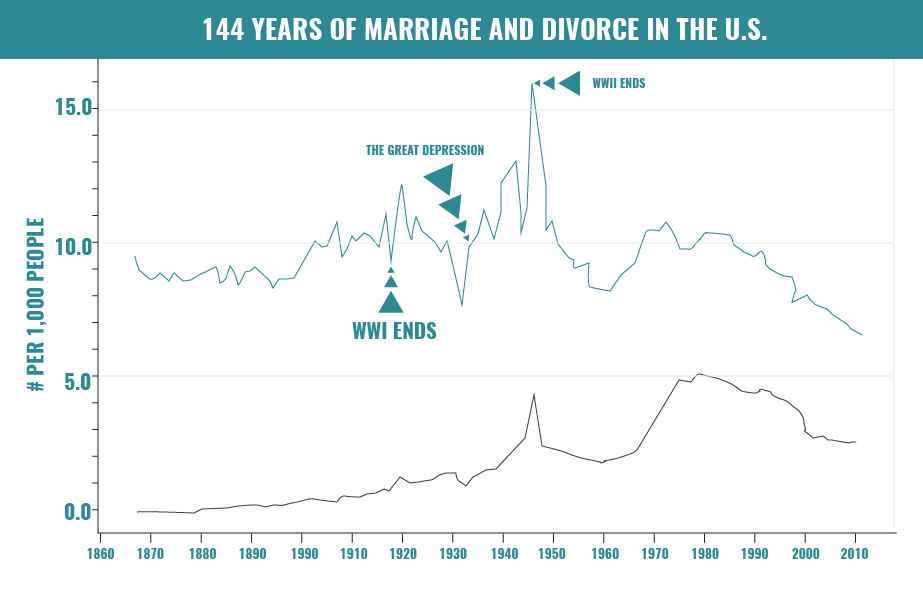
Yes, divorce rates have been declining. In fact, divorce rates have been declining since they peaked at close to 40% in 1980. In 2016, rates dropped to reach the lowest they have been in nearly 40 years. As of 2017, about 2.9 divorces occur per every 1,000 people.
How many divorces occur each day in the United States?
Researchers have estimated that a divorce occurs every 13 seconds in the United States. When you expand that statistic, that equates to about 276 divorces per hour and 6,646 divorces per day in the United States. To put that into perspective, it takes 2 minutes on average for a couple to recite their wedding vows. In that time, 9 divorces have occurred.
Which states have the highest divorce rates?
Divorce rates do vary by state and the variance between states can be quite large. The following 10 US states have the highest rates of divorce in the nation (by number of divorces per 1,000 residents):
- Arkansas (23.4)
- Idaho (21.9)
- Nevada (21.3)
- Louisiana (20.8)
- Oklahoma (20.4)
- Indiana (19.6)
- Wyoming (19.5)
- Montana (19.4)
- West Virginia (19.2)
- Tennessee (19.1)
Which US cities have the highest divorced populations?
Much like state divorce rates, rates also vary from city to city within any given state. The following cities have the highest number of divorced residents:
- Spokane, WA (15.925%)
- Toledo, OH (15.57%)
- Reno, NV (15.53%)
- Hollywood, FL (15.47%)
- St. Petersburg, FL (15.28%)
- Tacoma, WA (15.28%)
- Spring Valley, NV (15.11%)
- Birmingham, AL (15.1%)
- Tulsa, OK (15.09%)
- Dayton, OH (15.01%)
What are the largest reasons for divorce in the US?
There should be no surprises in the list of most common reasons for divorce. A healthy marriage requires compassion, respect, trust, and time. Lack of any of those key components will likely eventually result in divorce. The top reasons for divorce include:
- Lack of commitment (73%)
- Constant arguing (56%)
- Infidelity (55%)
- Married too young (46%)
- Unrealistic expectations (45%)
- Inequality in the relationship (44%)
- Unprepared for marriage (41%)
- Abuse (25%)
How long after marriage do divorces typically occur?
Studies have found that the highest percentage of divorces occur during the first eight years of marriage. If you’ve managed to reach your 10 year marriage anniversary, you are in really good shape. Couples married for 10 years or more are far less likely to get a divorce.
Do divorce rates vary by month?
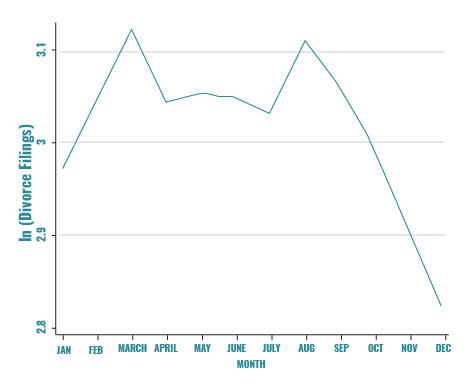
Divorce rates do vary by month. Experts believe that many couples avoid divorce during major holidays and vacation seasons to stay clear of conflict and emotional distress during times that would otherwise be filled with joy. During the month of December, there may also be hope that an impending new year may bring positive changes for a marriage. March and August fall in-between major holidays and vacation seasons, which is likely why divorces peak in those months.
How does education impact divorce?
Education does appear to play a role in the likelihood of divorce. On average, 42% of couples with a college education divorce compared to 47% of couples with less than a high school diploma.
Do work professions impact divorce?
It’s unlikely your profession plays a direct role in the outcome of your marriage, but certain professions do have higher divorce rates than others. Professions can be related to income and education level, which are more directly correlated with the probability of divorce. Professions with the highest divorce rates include:
- Dancers (43%)
- Bartenders (38.4%)
- Massage Therapists (38.2%)
- Gaming Service Workers (31.3%)
- Food & Tobacco Machine Operators (29.7%)
- Telephone Operators (29.3%)
- Textile Machine Operators (29%)
- Nurses (28.9%)
- Home Care Aids (28.7%)
Does age impact divorce?
The age when couples decide to get married can impact divorce. Studies have found that approximately 60% of couples who tie the knot between the ages of 20-25 years old will end up getting a divorce. Comparatively, couples who wait to get married until after 25 years of age are 25% less likely to get a divorce. The average age of a divorcing individual is 30 years old.
Do politics impact divorce?
Political affiliation likely does not play a strong role in divorce, but rates do vary among couples of different political stances. Studies have found that conservative couples are least likely to get a divorce. Religious beliefs could play a factor in lower divorce rates. Approximately 28% of all marriages among conservative couples end in divorce. Similarly, 33% of all marriages between moderate individuals end in divorce and 37% of all liberal marriages end in divorce.
How many years after divorce do individuals wait to remarry?
Typically, individuals who divorce end up re-marrying between three and four years after the divorce (if remarriage occurs at all).
Are marriages after a divorce less likely to succeed?
Unfortunately, studies have found that the likelihood of maintaining a successful marriage after divorce decreases as the number of prior divorces increases. Studies have found that 67% of second marriages and 73% of third marriages end in divorce.
Texas Divorce Statistics

Divorce rates by year (2004-2014)
Divorce rates in Texas have been declining in a rate in line with the national rate.
| Year | Number of Divorces | Percent increase/ Decrease from previous year | Divorces per 1,000 Residents |
| 2014 | 71,988 | 5.8% decrease | 2.7 |
| 2013 | 76,423 | 4.51% decrease | 2.9 |
| 2012 | 80,030 | 1.2% increase | 3.1 |
| 2011 | 79,024 | 3.8% decrease | 3.1 |
| 2010 | 82,098 | .33% increase | 3.3 |
| 2009 | 81,822 | 3% increase | 3.3 |
| 2008 | 79,438 | 2.1% increase | 3.3 |
| 2007 | 77,806 | 2.1% decrease | 3.3 |
| 2006 | 79,469 | 4.6% increase | 3.4 |
| 2005 | 75,980 | 6.6% decrease | 3.3 |
| 2004 | 81,324 | 3.6 |
Divorce rates by county (2014)
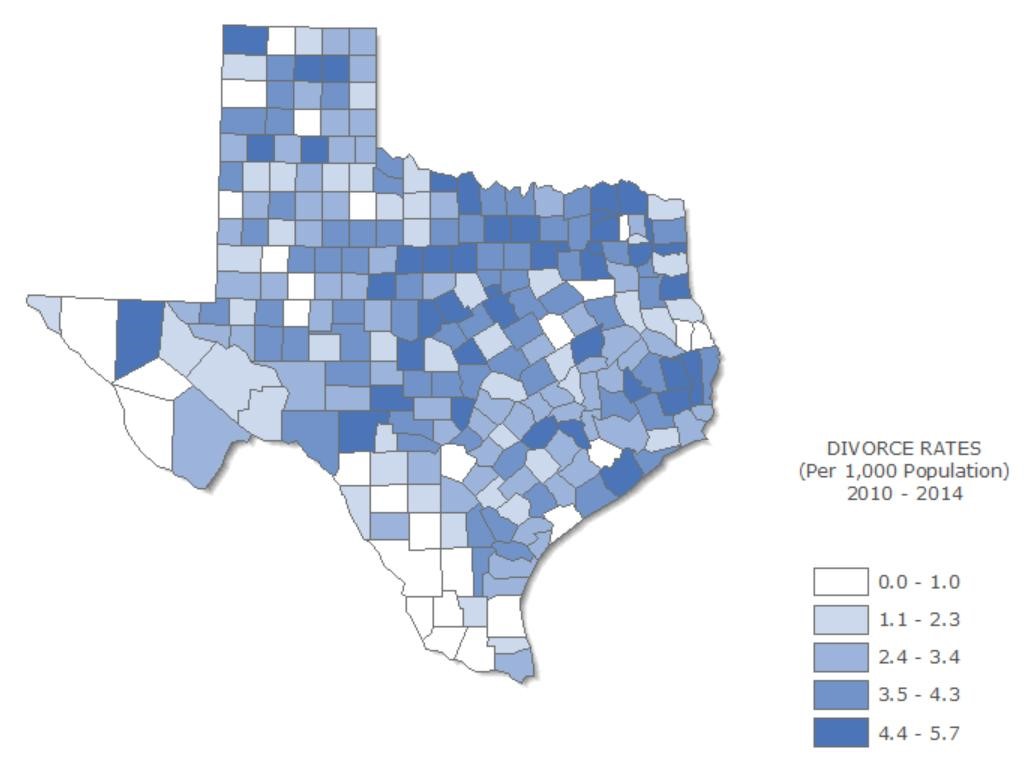
The northeast region of Texas is home to some of the highest divorce rates in the state. With a few exceptions, rates decrease the more southwest you go. Overall, Lamar County has the highest divorce rate in the state.
| County of Residence | Divorces Per 1,000 Residents |
| Bexar | 0.0 |
| Cochran | 0.0 |
| Fort Bend | 0.0 |
| Hidalgo | 0.0 |
| Hudspeth | 0.0 |
| Kenedy | 0.0 |
| King | 0.0 |
| Presidio | 0.0 |
| Franklin | 0.2 |
| Howard | 0.5 |
| San Augustine | 0.5 |
| Calhoun | 0.6 |
| Henderson | 0.6 |
| La Salle | 0.6 |
| Duval | 0.7 |
| Limestone | 0.7 |
| Webb | 0.7 |
| Armstrong | 0.8 |
| Dawson | 1.0 |
| Sabine | 1.0 |
| Baylor | 1.1 |
| Caldwell | 1.1 |
| Uvalde | 1.1 |
| Bowie | 1.2 |
| Camp | 1.2 |
| Cherokee | 1.2 |
| Nacogdoches | 1.2 |
| Frio | 1.3 |
| Pecos | 1.3 |
| Knox | 1.4 |
| Concho | 1.5 |
| Coryell | 1.5 |
| Gaines | 1.5 |
| Goliad | 1.5 |
| San Saba | 1.5 |
| Brazos | 1.6 |
| Hansford | 1.6 |
| Reeves | 1.6 |
| Ector | 1.7 |
| Lamb | 1.7 |
| Hale | 1.8 |
| Lynn | 1.8 |
| Williamson | 1.8 |
| Brooks | 1.9 |
| Ellis | 1.9 |
| Erath | 1.9 |
| Karnes | 1.9 |
| Wilbarger | 1.9 |
| El Paso | 2.0 |
| Maverick | 2.0 |
| Robertson | 2.0 |
| Shelby | 2.0 |
| Wheeler | 2.0 |
| Chambers | 2.1 |
| Harrison | 2.1 |
| Willacy | 2.1 |
| Hartley | 2.2 |
| Lavaca | 2.3 |
| Hall | 2.4 |
| Jackson | 2.4 |
| Jones | 2.4 |
| Brewster | 2.5 |
| Burleson | 2.5 |
| Titus | 2.5 |
| Bastrop | 2.6 |
| Crosby | 2.6 |
| De Witt | 2.6 |
| Parmer | 2.6 |
| Refugio | 2.6 |
| Swisher | 2.6 |
| Ward | 2.6 |
| Colorado | 2.7 |
| Garza | 2.7 |
| Runnels | 2.7 |
| Walker | 2.7 |
| Angelina | 2.8 |
| Crockett | 2.8 |
| Dimmit | 2.8 |
| Eastland | 2.8 |
| Hays | 2.8 |
| Hemphill | 2.8 |
| Kendall | 2.8 |
| Medina | 2.8 |
| Trinity | 2.8 |
| Atascosa | 2.9 |
| Falls | 2.9 |
| Floyd | 2.9 |
| Travis | 2.9 |
| Archer | 3.0 |
| Collingsworth | 3.0 |
| Donley | 3.0 |
| Wharton | 3.0 |
| Wilson | 3.0 |
| Aransas | 3.1 |
| Childress | 3.1 |
| Dickens | 3.1 |
| Freestone | 3.1 |
| Kleberg | 3.1 |
| Lee | 3.1 |
| Nolan | 3.1 |
| Waller | 3.1 |
| Carson | 3.2 |
| Harris | 3.2 |
| Hockley | 3.2 |
| Houston | 3.2 |
| Lipscomb | 3.2 |
| Ochiltree | 3.2 |
| Orange | 3.2 |
| Washington | 3.2 |
| Yoakum | 3.2 |
| Cameron | 3.3 |
| Gillespie | 3.3 |
| Grayson | 3.3 |
| Grimes | 3.3 |
| Jefferson | 3.3 |
| Madison | 3.3 |
| Martin | 3.3 |
| Menard | 3.3 |
| Mitchell | 3.3 |
| Smith | 3.3 |
| Sterling | 3.3 |
| Andrews | 3.4 |
| Guadalupe | 3.4 |
| Nueces | 3.4 |
| Sutton | 3.4 |
| Bandera | 3.5 |
| Deaf Smith | 3.5 |
| Fannin | 3.5 |
| Gregg | 3.5 |
| Hill | 3.5 |
| Hunt | 3.5 |
| Parker | 3.5 |
| San Patricio | 3.5 |
| Schleicher | 3.5 |
| Coleman | 3.6 |
| Cooke | 3.6 |
| Haskell | 3.6 |
| Jim Wells | 3.6 |
| Newton | 3.6 |
| Tom Green | 3.6 |
| Val Verde | 3.6 |
| Fisher | 3.7 |
| Galveston | 3.7 |
| Matagorda | 3.7 |
| Mills | 3.7 |
| Navarro | 3.7 |
| Reagan | 3.7 |
| Terry | 3.7 |
| Winkler | 3.7 |
| Wood | 3.7 |
| Cass | 3.8 |
| Collin | 3.8 |
| Hood | 3.8 |
| Potter | 3.8 |
| Anderson | 3.9 |
| Bee | 3.9 |
| Bell | 3.9 |
| Johnson | 3.9 |
| Liberty | 3.9 |
| Montague | 3.9 |
| Montgomery | 3.9 |
| Polk | 3.9 |
| Comal | 4.0 |
| Gonzales | 4.0 |
| Kerr | 4.0 |
| Live Oak | 4.0 |
| Llano | 4.0 |
| McLennan | 4.0 |
| Rusk | 4.0 |
| Scurry | 4.0 |
| Hardeman | 4.1 |
| Kaufman | 4.1 |
| Lubbock | 4.1 |
| Tarrant | 4.1 |
| Young | 4.1 |
| Burnet | 4.2 |
| Coke | 4.2 |
| Hamilton | 4.2 |
| Jack | 4.2 |
| Milam | 4.2 |
| Moore | 4.2 |
| Stonewall | 4.2 |
| Upton | 4.2 |
| Bailey | 4.3 |
| Callahan | 4.3 |
| Gray | 4.3 |
| Mason | 4.3 |
| Midland | 4.3 |
| Randall | 4.3 |
| Victoria | 4.3 |
| Brown | 4.4 |
| Delta | 4.4 |
| Denton | 4.4 |
| Marion | 4.4 |
| Bosque | 4.5 |
| Briscoe | 4.5 |
| Clay | 4.5 |
| Jasper | 4.5 |
| McCulloch | 4.5 |
| Morris | 4.5 |
| Panola | 4.5 |
| Rockwall | 4.5 |
| San Jacinto | 4.5 |
| Shackelford | 4.5 |
| Leon | 4.6 |
| Somervell | 4.6 |
| Stephens | 4.6 |
| Austin | 4.7 |
| Castro | 4.7 |
| Van Zandt | 4.7 |
| Dallas | 4.8 |
| Kimble | 4.8 |
| Blanco | 4.9 |
| Comanche | 4.9 |
| Hopkins | 4.9 |
| Palo Pinto | 4.9 |
| Rains | 4.9 |
| Roberts | 4.9 |
| Wichita | 4.9 |
| Hardin | 5.0 |
| Hutchinson | 5.0 |
| Wise | 5.0 |
| Brazoria | 5.1 |
| Taylor | 5.1 |
| Fayette | 5.2 |
| Red River | 5.2 |
| Tyler | 5.2 |
| Dallam | 5.5 |
| Lampasas | 5.6 |
| Upshur | 5.6 |
| Lamar | 5.7 |
| Borden | — |
| Cottle | — |
| Crane | — |
| Culberson | — |
| Edwards | — |
| Foard | — |
| Glasscock | — |
| Irion | — |
| Jeff Davis | — |
| Jim Hogg | — |
| Kent | — |
| Kinney | — |
| Loving | — |
| McMullen | — |
| Motley | — |
| Oldham | — |
| Real | — |
| Sherman | — |
| Starr | — |
| Terrell | — |
| Throckmorton | — |
| Zapata | — |
| Zavala | — |